Click here to view the visualization for Assignment 1, designed from Seattle crime data
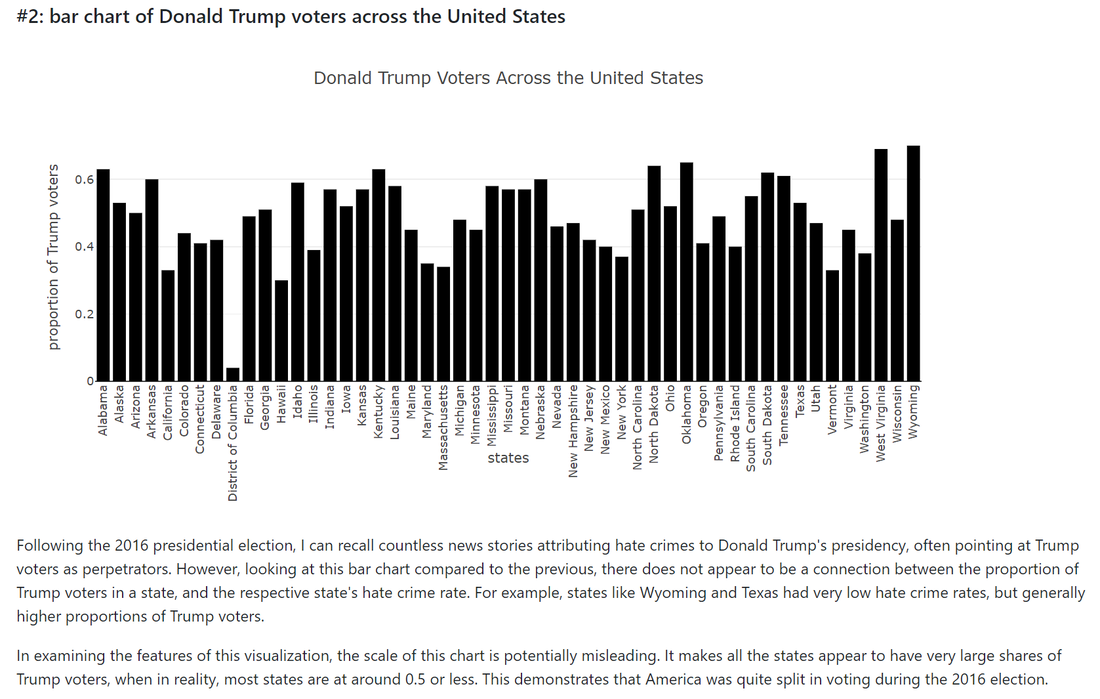
Click here to view Assignment 2, an exploratory data analysis of a dataset of hate crime data.
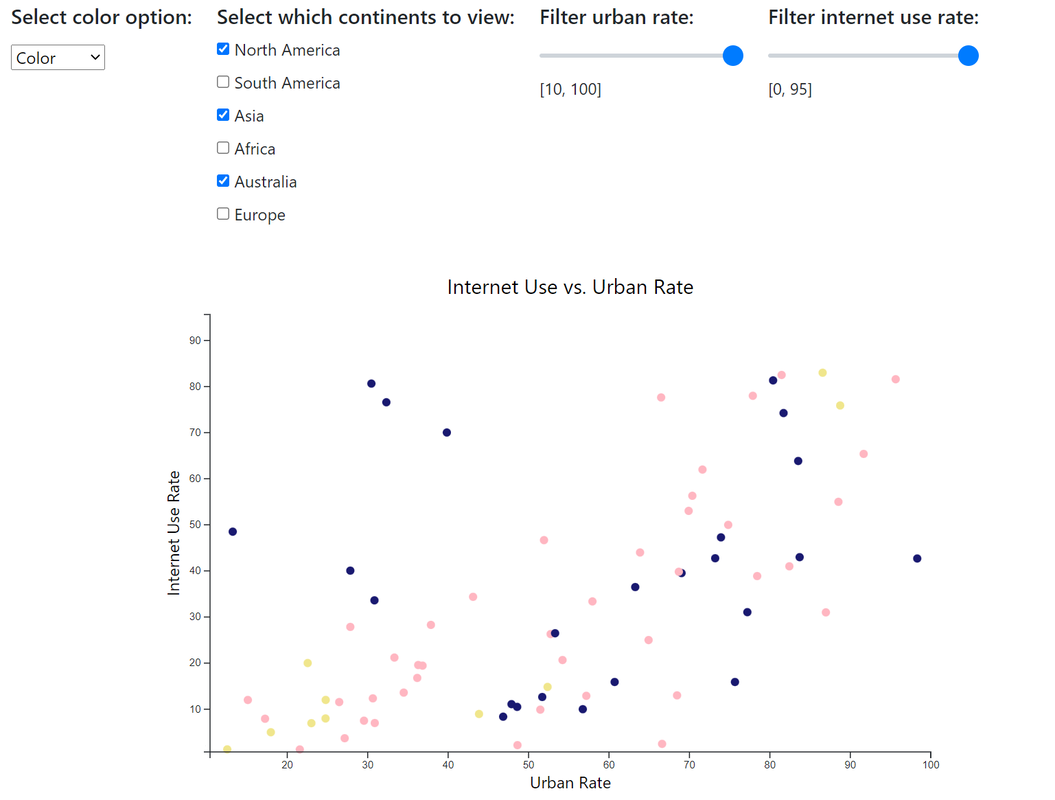
Click here to view Assignment 3, an interactive data exploration of datasets comparing internet use and urban rate across the globe.
I was really excited to take INFO 474 because it had been a struggle trying to register for this course. I had to wait until the very last registration period, and there were only a few spots open to non-majors. Although it was different than what I expected, I still enjoyed the class content overall. The most important thing I learned from this course was how to make design decisions regarding the creation of data visualizations--determining which type of graph to use, whether or not to include color, etc.
Assignments 1 and 2 were completed individually, while 3 and 4 I completed with a partner. Most of this course were adapted from assignments from another course at UW, CSE 442.
Assignments 1 and 2 were completed individually, while 3 and 4 I completed with a partner. Most of this course were adapted from assignments from another course at UW, CSE 442.
